Week 16 Blog - Hypothesis Testing
For this assignment, I will use the DOE experimental data that my practical team have collected both for FULL Factorial and FRACTIONAL Factorial and test some hypothesis.
DOE PRACTICAL TEAM MEMBERS (fill this according to your DOE practical):
1. Nigel
2. Vernon
3. Madeline
4. Miguel
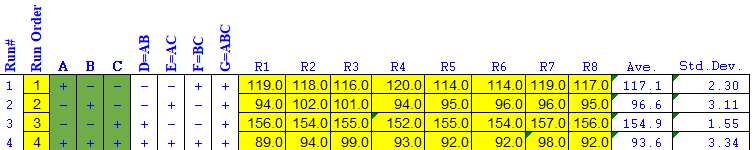
Factor A: Start Angle in degrees [ 0 (-) , 35 (+) ]
Factor B: Stop Angle in degrees [ 60 (-) , 90 (+) ]
Factor C: Arm Length in cm [ 25 (-) , 31 (+) ]
Data collect for FULL factorial design using CATAPULT A:

Data collect for FRACTIONAL factorial design using CATAPULT B:
Nigel (me) will use Run #1 from FRACTIONAL factorial and Run#2 from FULL factorial.
Miguel will use Run #2 from FRACTIONAL factorial and Run #3 from FULL factorial.
Vernon will use Run #3 from FRACTIONAL factorial and Run #5 from FULL factorial.
Madeline will use Run #4 from FRACTIONAL factorial and Run #8 from FULL factorial.
The QUESTION | The catapult (the ones that were used in the DOE practical) manufacturer needs to determine the consistency of the products they have manufactured. Therefore they want to determine whether CATAPULT A produces the same flying distance of projectile as that of CATAPULT B.
|
Scope of the test | The human factor is assumed to be negligible. Therefore different user will not have any effect on the flying distance of projectile.
Flying distance for catapult A and catapult B is collected using the factors below: Arm length = 25 cm Start angle = 35 degrees Stop angle = 60 degrees
|
Step 1: State the statistical Hypotheses: | State the null hypothesis (H0): Catapult A and B produce the same flying distance of the projectile. 𝜇A = 𝜇B Assuming µ is the flying distance of the projectile.
State the alternative hypothesis (H1): Catapult A and B do not produce the same flying distance of the projectile. 𝜇A ≠ 𝜇B Assuming µ is the flying distance of the projectile.
|
Step 2: Formulate an analysis plan. | Sample size is 8 runs. Since 8 runs is a small sample size, Therefore t-test will be used.
Since the sign of H1 is ‘≠’, a two tailed test is used.
Significance level (α) used in this test is 0.05
|
Step 3: Calculate the test statistic | State the mean and standard deviation of sample catapult A: nA = 8 runs Mean = 89.4cm Standard Deviation = 1.41cm
State the mean and standard deviation of sample catapult B: nA = 8 runs Mean = 117.1cm Standard Deviation = 2.30cm
Compute the value of the test statistic (t): 
=squroot(8x1.41^2+8x2.30^2/8+8-2) = 2.039
t=89.4-117.1/2.039xsquroot(1/8+1/8) = -27.17
v = 8 + 8 -2 = 14
At a significance level of 0.05, percentile is the 97.5th
|
Step 4: Make a decision based on result | Type of test (check one only) Left-tailed test: [ __ ] Critical value tα = - ______ Right-tailed test: [ __ ] Critical value tα = ______ Two-tailed test: [ ✓ ] Critical value tα/2 (t0.975) = ± 2.145
Use the t-distribution table to determine the critical value of tα or tα/2 
Compare the values of test statistics, t, and critical value(s), tα or ± tα/2 Since the test statistic, t = -27.17 lies in the rejection region, the null hypothesis is rejected. At 0.05 level of significance, Catapult A and B do not produce the same flying distance of the projectile
Therefore Ho is rejected.
|
Conclusion that answer the initial question | Since the null hypothesis is rejected, the alternative hypothesis is accepted. Catapult A and B do not produce the same flying distance of the projectile.
|
Compare your conclusion with the conclusion from the other team members.
What inferences can you make from these comparisons? | My conclusion is the same as the conclusion from my other team members except for Miguel as we did use catapult B for Run 2 in the FULL factorial. Although my hypothesis is the same as my other group members, my t value is significantly higher than the other group members (range from -0.84 to -5.3) . This could be due to the fact that my mean values are significantly different. Since my group members whose runs used different catapults have the same hypothesis as mine, I can conclude that Catapult A and B do not produce the same distance despite having the same factors. One thing I can infer from my group members values is that all of their values are negative. Based on the formula given above, X2>X1 so Catapult B launches the ball further than Catapult A. |
I find this activity very enjoyable to me as I am a maths guy. I applied what was taught in the tutorial lesson and the practice questions in this activity and was able to do it in ease. Even though it was clear from the experiment data that one catapult was different from the other, I was not able to present it in a very professional way but through this activity, I was able to learn the right way to present my hypothesis. I will definitely come back to this blog to refer for future uses. Some experimental data will not give a clear hypothesis like this experiment, so I will definitely apply this knowledge to test my hypothesis.

No comments:
Post a Comment